Introduction
As is slowly becoming a widely-known fact, the meat and animal product industry is significantly more carbon-intensive than plant-based foods. The amount of CO2 produced per kg (or even kcal) of meat or animal product is much higher than the amount of CO2 for the equivalent mass of plants, e.g., fruits, vegetables, legumes. One might think, then, that the best way to reduce one’s “carbon foodprint” (carbon footprint due to food production) is to take on a vegetarian or vegan diet.
What is intriguing is that this may not be the answer in all cases. Based on where food is sourced, what time of year it is grown, and how it is produced, the carbon emissions can change drastically. A hot house tomato grown out of season can produce less carbon than pasture-fed goat meat, for example.
An important question that data can answer, then, is how an eco-friendly citizen can best adapt their diet, based on their specific living circumstances, to reduce their carbon foodprint. Here, we will perform an in-depth analysis on Switzerland, examining how a consumer’s dietary choices affect their individual carbon emissions. This will include an analysis of carbon intensities by food type and the various types and sources of food that are imported into Switzerland. After all, since Switzerland has a fairly dense population for its small size, it imports a significant amount of its food; as of 2015, Switzerland’s food self-sufficiency rate, defined by the FAO as “the extent to which a country can satisfy its food needs from its own domestic production”, was approximately 59%. A large amount of the foods imported are plant-based.
Depending on what types of food Switzerland is importing and from where, this raises the possibility that a Swiss citizen might have a smaller carbon foodprint by eating more meat, contradicting the typical recommendation. Would living with a vegan diet require an excessive amount of imported foods, outweighting the carbon offset of not eating meat? Or is there a large enough amount of carbon produced by the meat industry that eating a plant-based diet is still more sustainable?
We will attempt to answer the question:
How can a Swiss consumer best adapt their diet to reduce their carbon “foodprint”, based on several factors that go into the carbon emissions of food production?
Note that we are assuming this analysis will be utilized by a Swiss consumer, and not by the government or any authoritative figure. Therefore, the utility of this analysis comes while assuming that nothing about the given situation will change (for example, Switzerland will not make a policy to start domestically producing more bananas); rather, we are looking to give an individual consumer insight into their carbon levels.
Some of the sub-questions we will attempt to answer in this analysis include:
- Among Swiss consumption, how much of the various food types (e.g. bananas, beef, oats) are domestically produced versus imported?
- How far away do these imports come from? (The farther food is imported from, generally the higher the associated carbon “cost” of transporting the food to Switzerland.)
- Among the various meats and animal products, which ones are more carbon-efficient? How do these compare to the carbon efficiency of plant-based foods?
Data for this project was sourced from the Food and Agriculture Organization of the United Nations (FAO) and Swiss Impex. More details on these datasets can be found on the GitHub project repository. Note that the most recent data available from FAO for food production in Switzerland was 2017, so all data is from this year.
Imports and Exports
Let’s first start by digging into Swiss imports and exports. We can categorize all the foods based on 6 metacategories: fruits, vegetables, cereals, meats, seafood, and animal products.
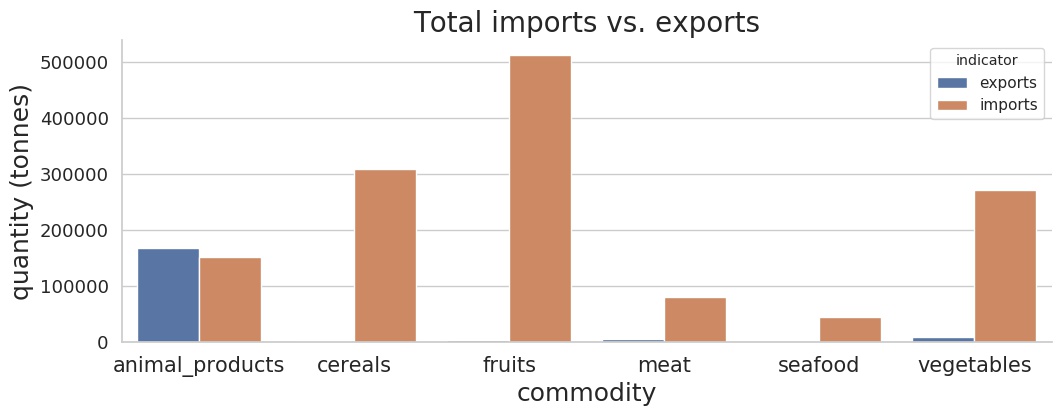
As can be seen in this plot, Switzerland imports far more than it exports overall. This fits with a general knowledge of the country; Switzerland is rather small and has a relatively dense population, and thus must import significant amounts of food to sustain its citizens. Furthermore, since it has such a low food self-sufficiency, it does not have a lot of food to spare to export.
The animal products category on this graph - that is, non-meat animal-derived products such as dairy products - is rather intriguing compared to the others, since the import and export quantities are about equal. Why might this be? We can take a further look into the specific subcategories of the animal products foods:
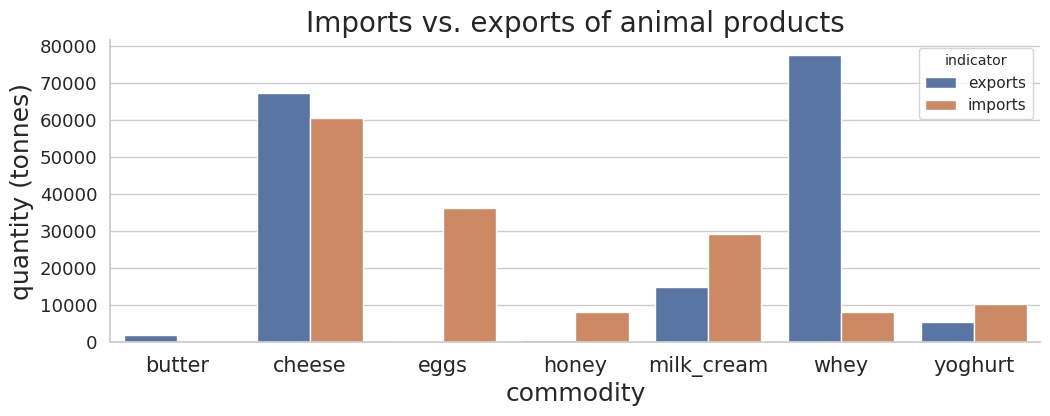
This graph brings more light to the topic. Although the animal products metacategory had roughly equal imports and exports, the subcategories reveal a different story. Switzerland is indeed importing and exporting different products, rather than simply acting as a transport hub for food items traveling through. Cheese, a category of which there are many different flavors and consumers like variety, is both heavily imported and exported, likely giving consumers access to a wider variety of cheese types.
Dairy products are one of the few items of which Switzerland has enough excess production to also export some of it, most notably whey and cheese. Eggs, on the other hand, are nearly exclusively imported.
At first glance, butter might puzzle the reader; the values of imports and exports are both low, so is it possible that the Swiss do not eat butter? Of course, this is hardly the case. Imports and exports are only part of the broader picture of what the Swiss consume, which also includes domestic production. It is likely that Swiss demand for butter is approximately equal to the amount produced within the country, and thus imports and exports are both low. We will return to the topic of how domestic consumption affects our analysis later on.
Incorporating Location
We have taken a glance at the imports and exports of food by category in Switzerland. In regards to analyzing the carbon foodprint of Swiss consumers, another extremely important aspect of this trading is where all the imported food comes from. Foods that are transported from farther across the globe have a higher carbon cost associated with their transport. Thus, if certain types of food consistently come from distant countries, those foods would be better off avoided by an eco-conscious consumer. We can plot the imports by the continent it comes from and the metacategory of food, weighted by how much of that food is imported.
It turns out that Switzerland imports a vast majority of its food from other countries within Europe. From our analysis, we calculated that 76% of all Swiss food imports come from countries within a 1000 km radius of Switzerland. America, from which Switzerland imports significantly less than from Europe, is the next biggest trading partner.
Domestic Production and Consumption
The next step in the Swiss foodprint analysis is to incorporate the FAO data about the food that Switzerland produces. By combining the data on imports, exports, and domestic production, we can calculate how much the Swiss population consumes, and of that consumption, how much of each food is produced in Switzerland versus imported. Our calculation for the total amount of food consumed in Switzerland (including food waste) can be calculated via:
Swiss consumption = domestic production + imports - exports
From this figure, we can also calculate how much of what is consumed by the Swiss population is produced domestically versus imported.
Other than seafood and fruit, Switzerland feeds its citizens more with domestically-produced foods than imported foods. The two exceptional categories make sense; Switzerland is a land-locked country with a cooler climate than most fruit grows in, so it is only natural that the country imports more of these foods than it produces.
Note that in our analysis, we assumed that exports were first sourced from the Swiss-produced foods, then if there were more exports than produced in Switzerland, imports were also opened up to the possibility of exportation. The fact that most of these items show a higher percentage of domestically produced consumption means that this was likely a valid assumption; even with Swiss production being prioritized for exports, there is still more domestically produced food available to Switzerland’s citizens than imported food (for every category except fruit and seafood).
Carbon Emissions
‘Food miles’, or the distance that food must travel to arrive on a consumer’s plate, clearly have an impact on the carbon emissions of the products consumed. The farther a country is, the more carbon emissions it would cost to import food from that country. The method of transport, whether by plane, boat, train, or truck, is also key, given that air transport emits approximately 40 times more carbon than the equivalent distance by container ship.
Now that we have gathered the information about where the food eaten in Switzerland is sourced from, we can begin to consider the carbon impact of these foods. Emissions of a food product can be expressed as CO2e (carbon dioxide equivalent), condensing the impact of all greenhouse gases into a single number. For the remainder of this analysis, we will refer to the emissions of food items as carbon-related, though all numbers are CO2 equivalents.
The CO2e of a food item comes from both its inherent carbon cost of production as well as the carbon cost of transporting that item from its country of origin to where it is consumed. Luckily, data is available on how various foods enter and exit Switzerland, opening up the possibility of calculating the carbon cost of each type of food based on what countries it comes from and by which transport method. Aggregating the results into the metacategories of food, we can see the following trend of total CO2e normalized by how much of that food item is consumed in Switzerland:
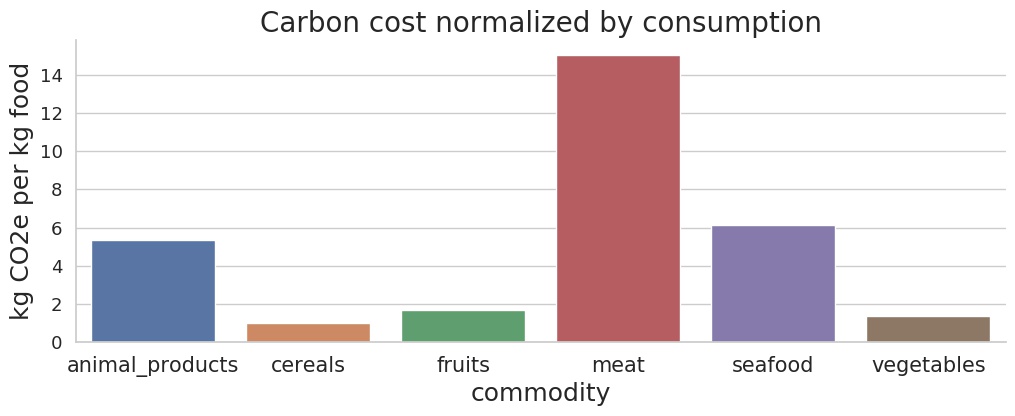
This begins to answer our research question of how a Swiss consumer can reduce their carbon impact. Even though our analysis has shown that very little meat is imported compared to the other food groups, meat is still by far the most carbon-intensive food group. All three animal-based categories are in fact higher than the three plant-based food groups. This leads us to the question of looking further into transport. How important is transport actually in the carbon intensities of foods? Clearly the transport carbon costs did not overwhelm the inherently high carbon cost of producing meat, so perhaps it is not actually important relative to the inherent carbon cost.
Closer Look: Transport Carbon Costs
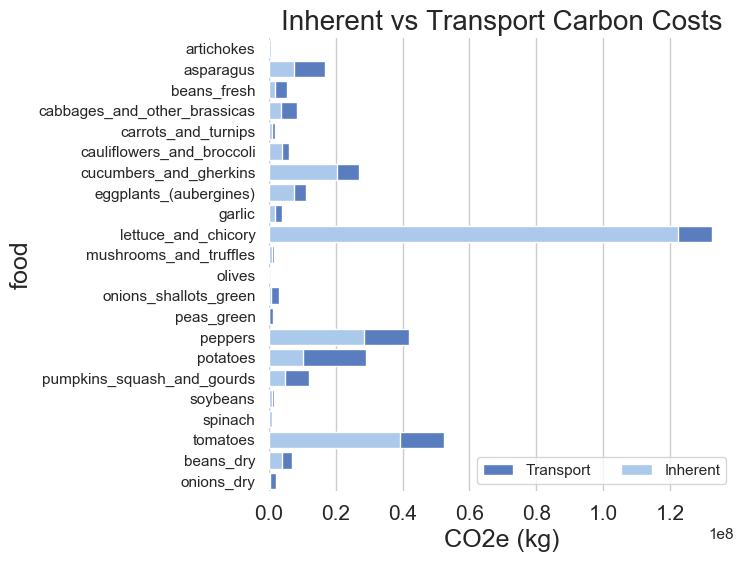
One way to demonstrate how much transport factors into the carbon cost of a food item is to directly compare the transport cost to the inherent cost of producing that item. Meats have the highest inherent cost of all food groups, so perhaps their transport cost is relatively low.
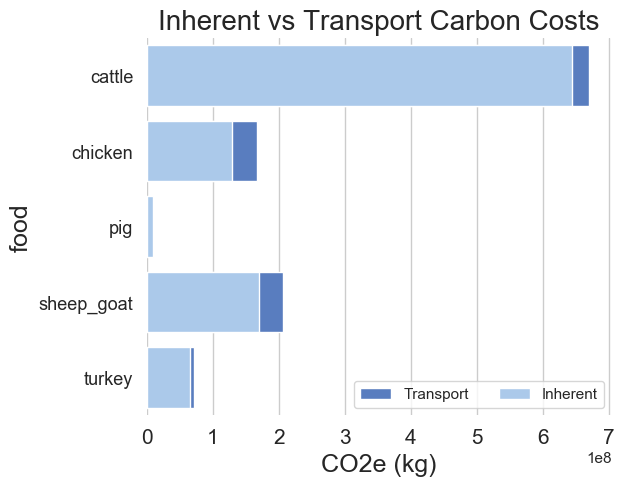
Indeed, it appears that in comparison to the inherent cost of producing the meat, the carbon emissions from transport are extremely low across all animal types. But what about a low carbon intensity food group, such as vegetables?
Surprisingly, for most vegetables, the inherent cost is still relatively higher than the transport. This leads us to believe that the inherent production cost is the far greater influencer on a food’s overall carbon output rather than transport. There are of course a few exceptions to this rule, such as asparagus and potatoes. One can speculate as to why these vegetables have such high transport costs; that depends on which countries these foods come from and how they reach Switzerland.
Correcting the Transport Data
Information regarding the transport methods of different food items is notoriously difficult to obtain. While the Swiss Federal Customs Administration’s Impex data contains extremely detailed information on import and export statistics, the data available for transport methods is very sparse. Transport data was only available in six categories: potatoes, fresh fruit and vegetables, dairy products, meat, cereals, and fish. Given the fact that all fresh fruit and vegetables are clearly not transported in the same manner, such a broad generalization makes it very difficult to see the difference between the produce. For example, raspberries have a shelf-life of 1-3 days and would often be transported by plane, whereas onions have a very long shelf-life and it would not make sense to fly them to their destination. As a result, this method will not highlight produce that should potentially be avoided due to their high transport costs, such as perishable exotic fruits which travel by plane.
Furthermore, the data provided by Impex only states the method by which the imports crossed the Swiss border. Hence, if a food item was brought by boat from its country of origin to Rotterdam, the largest European shipping port and then by train from Rotterdam to Switzerland, the Swiss transport data lists the item as coming from its country of origin by train. Being a landlocked country, only very few shipments arrive by inland waterways. The majority of items coming from overseas would likely arrive by ship, before continuing to Switzerland by the transport method which is actually recorded. This clearly biases the transport emissions for such shipments.
For our original analysis, we took the data at face value; that is, if apples were listed as coming to Switzerland by train from New Zealand, we calculated the carbon cost of transport assuming that the apples traveled by train the distance between Switzerland and New Zealand. In an attempt to correct for this strange assumption, we implemented a change to our analysis: for all items coming from outside Europe to Switzerland by rail or road, we first calculate the carbon cost of sending these items by boat to Rotterdam, then traveling the rest of the way from Rotterdam to Switzerland by the original transport method provided. This gives a more accurate estimation in some cases, such as imports from America/Oceania, but in other cases its utility is debatable. This is particularly true in the case of Northern African countries, where it is impossible to know how much of the journey would have been undertaken by ship. Routing the products from Northern Africa through Rotterdam essentially prolongs their journey, and could result in unrealistically high carbon estimates.
We can compare how this change affects the carbon costs of various foods. Let’s take a look at vegetables using both analysis methods (face value and with Rotterdam implemented):
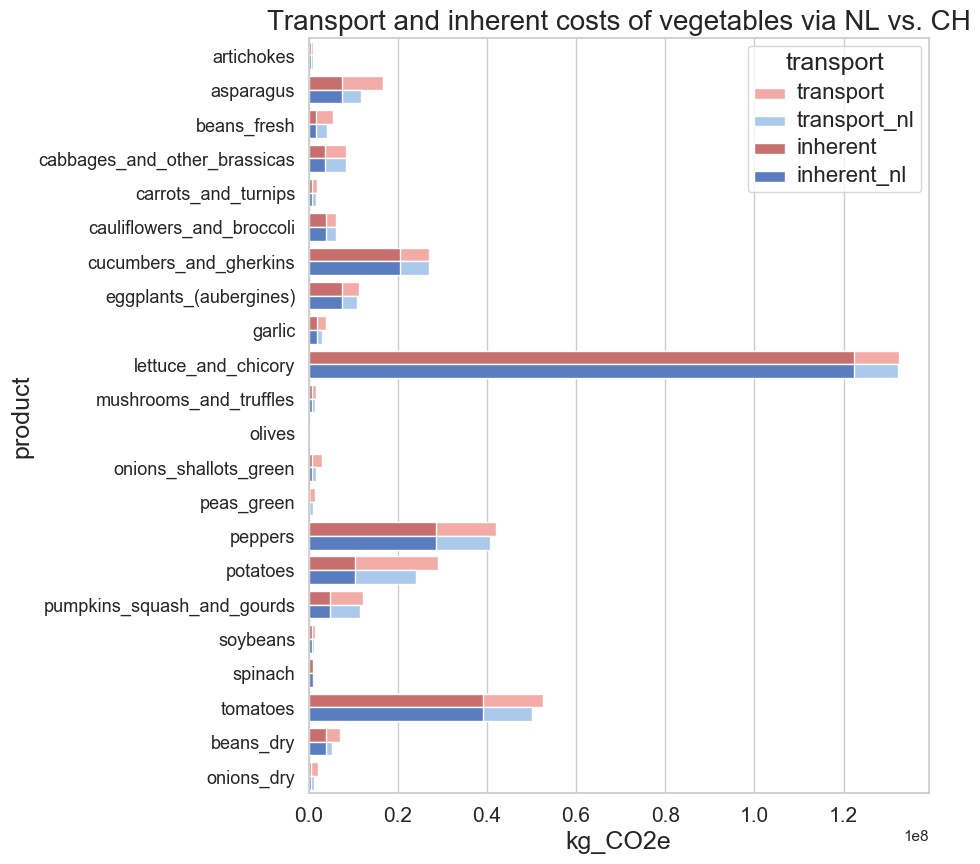
As we had seen earlier, the inherent production cost of vegetables is far more influential on the total carbon emissions than the carbon contribution from transport. What comes to light from this graph, however, is that it hardly makes a difference that the original data is inaccurate. Considering that vegetables come through Rotterdam makes such a small impact on the analysis because transport has so little to do with the carbon cost, even for low-carbon food items like vegetables. The effect of incorporating the Rotterdam assumption is minimal in most cases, being more marked when the majority of the produce originates a long way from Switzerland, e.g. asparagus. Neither of these approximations are optimal, as they blanket all fruit and vegetables under the same transport conditions, which is far from the truth. Given the lack of detailed information, the numerical figures regarding transport emissions are of limited value in terms of product specific estimates and recommendations and can only really be used on a very broad scale.
Conclusion
Regardless of all the special considerations which come into play regarding Switzerland - the fact that it is landlocked, its climate is far from ideal for fruit production, and its self-sufficiency is fairly low - it seems that meats have once again emerged as the culprit of the individual’s carbon foodprint. A summary of our findings can be visualized in a comparison between the carbon emissions per amount of food for three groups: meats and seafood, non-meat animal products, and plant-based foods.
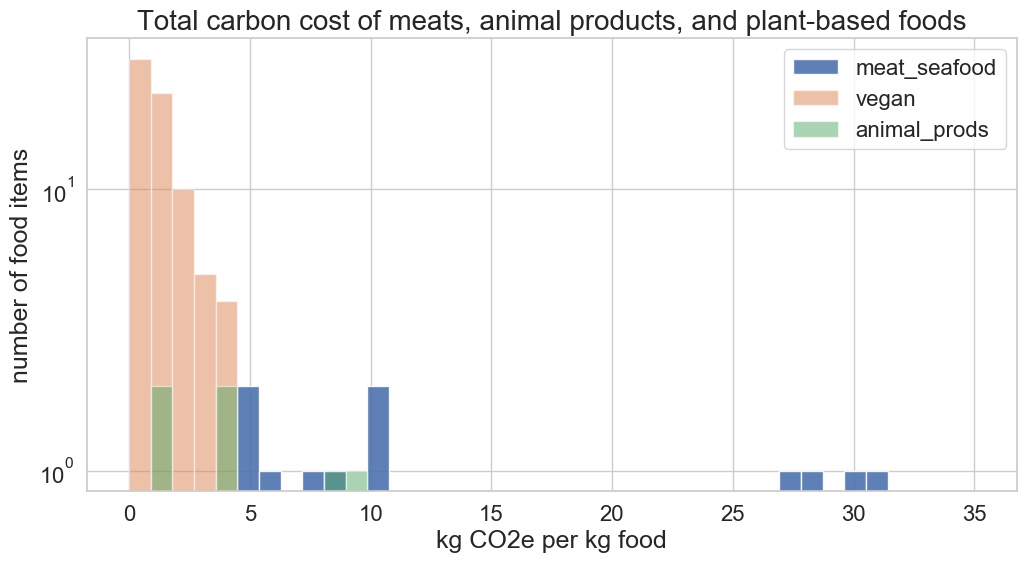
As would match intuition and previous reports on this topic, all of the plant-based foods fall low on the carbon spectrum. Meats and animal products, on the other hand, span a wider range, with meats reaching by far the highest carbon intensities. Even accounting for transport from the specific countries that these products come from, there is no possible conclusion in which meats are exonerated. The recommendation for those living in Switzerland wishing to reduce their carbon foodprint remains the same as all recommendations found in the literature: a vegan diet is truly the healthiest for the planet.
Reflection: Is This Analysis Realistic?
As public awareness of the impact of carbon emissions increases, it is key to attempt to understand related causes and implications. This is particularly true in terms of diet, as it is something that we, as individuals, can easily have an effect on. There is a vast amount of publicly available information regarding carbon emissions and food production and transport and sorting through this to determine what concrete steps one can take to reduce their ‘carbon foodprint’. Initially, our goal was to try to reconcile some of the myriad data sources available to present data relevant to Swiss consumers. A number of issues were encountered in this process, particularly in terms of obtaining country-specific emissions data, transport data (as discussed above) and information about seasonality, which are key aspects in determining the carbon emissions of the food products sitting on our supermarket shelves.
Production Emissions
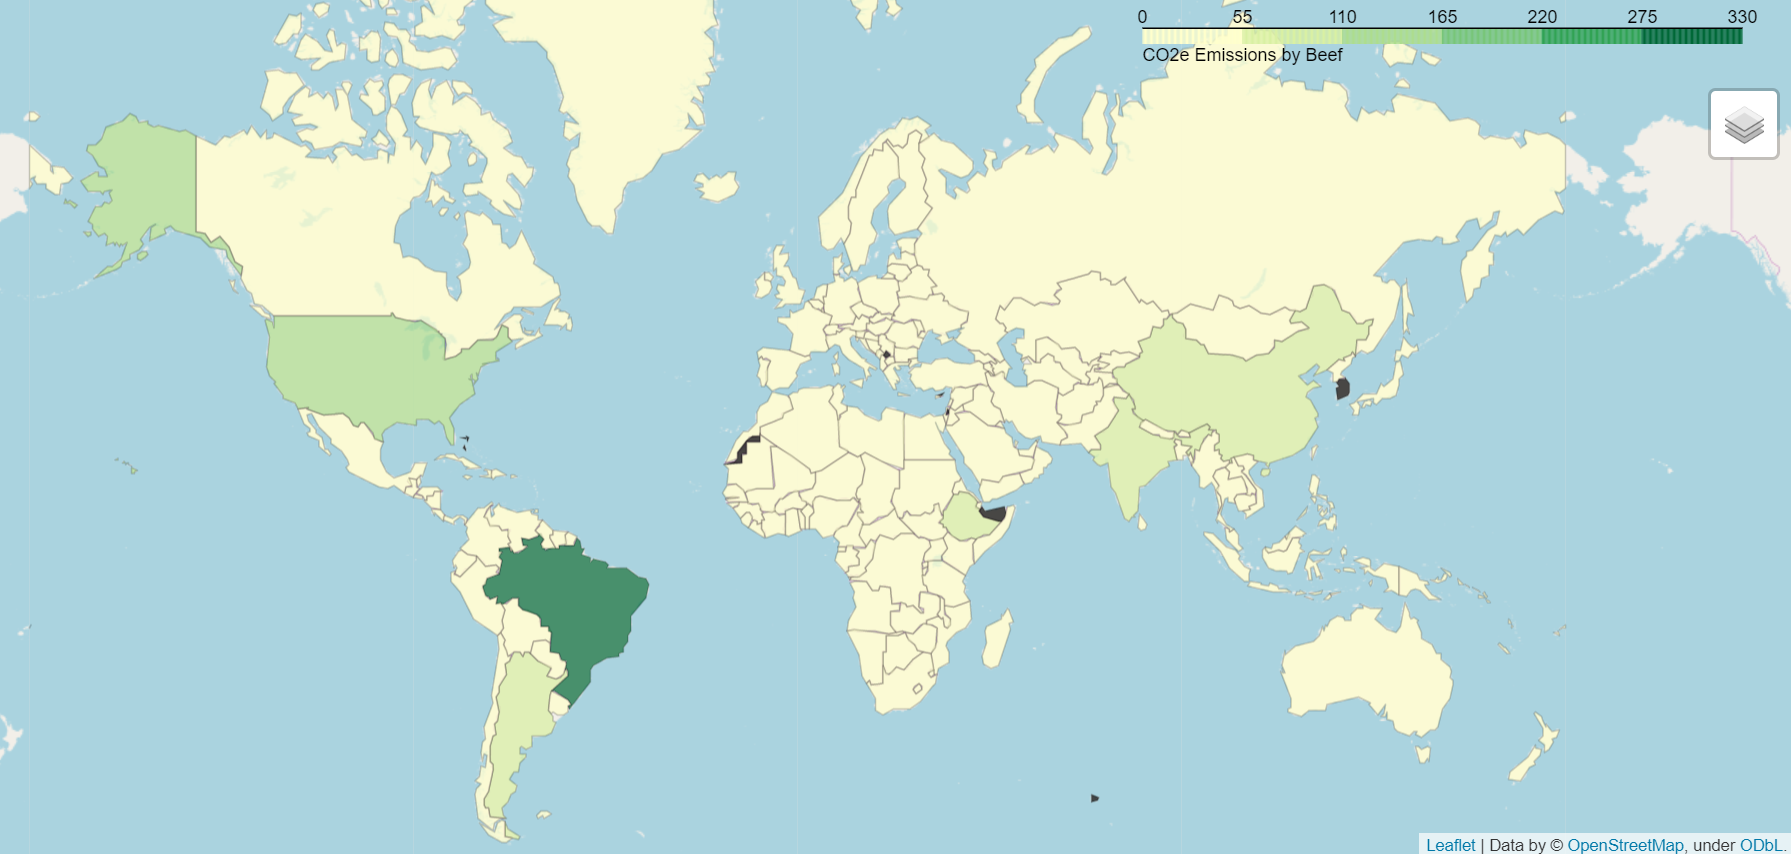
The Food and Agriculture Organizations of the United Nations (FAO) have comprehensive data on the CO2 emission intensities for a number of different food types. This data is country-specific, for every country worldwide, but unfortunately only covers a small subset of foods, namely meats. As Switzerland sources its foodstuffs globally, information regarding production-specific carbon emissions in these countries would have been invaluable in terms of estimating the overall effect of the products consumed in Switzerland. The map below shows an example of the large variation that can be observed in carbon emissions from country to country, in this case in the production of beef. This highlights the insight such information would offer, instead of using global average values. As the country-specific data was only available for such a small subset of products, the global averages were used for all products in the interests of consistency.
Seasonality
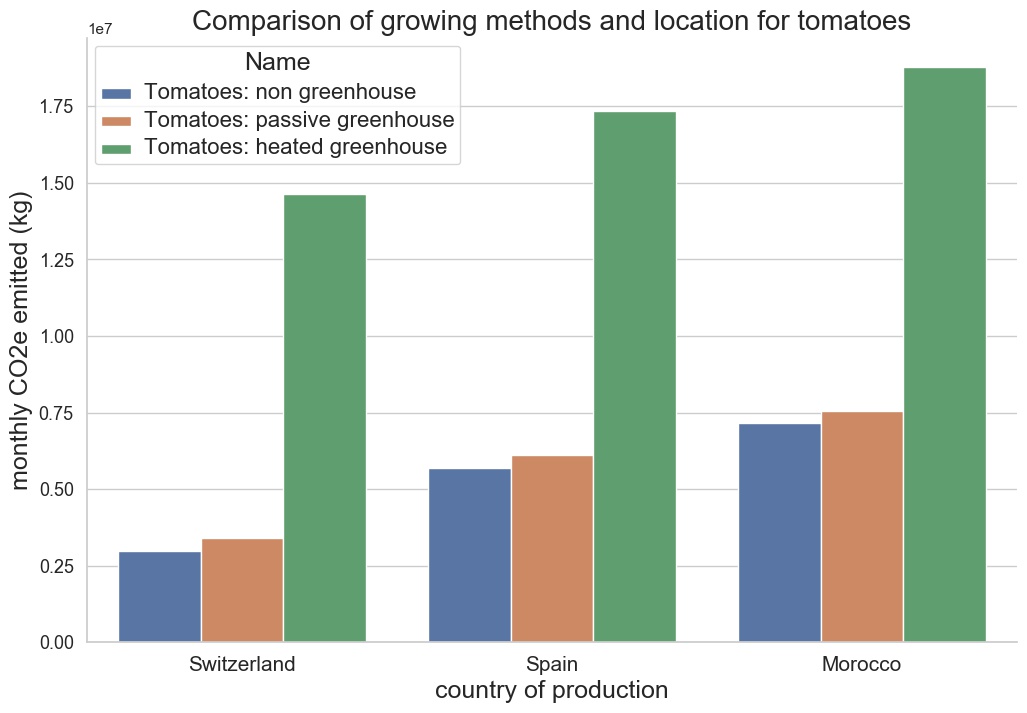
Seasonality is one of the hardest factors to quantify, yet can have an important effect on carbon emissions for seasonal produce. Just to take an example, let’s compare tomatoes grown by different methods. For example, tomatoes grown outside of a greenhouse have a lower carbon impact than tomatoes grown in greenhouses. But how does the carbon cost of transport compare to the carbon cost of these higher intensity methods? We can quantify the comparison by looking at the carbon costs of the amount of tomatoes consumed in Switzerland if they were grown in Switzerland or abroad, then transported. For each country, we will compare three growing methods. The countries included in this analysis are the warmer neighboring countries of Spain and Morocco, the biggest tomato trading partners of Switzerland within and outside of Europe, respectively. We can see that the difference between tomatoes grown in the exterior, or in a non-heated greenhouse in Switzerland is minimal. However, in months where it is too cold to grow tomatoes in Switzerland without additional heating, would it be more efficient to transport tomatoes from abroad? The inherent carbon cost of tomatoes produced in heated greenhouses is so high that, even when transport costs are taken into account, it would be advantageous to import naturally/passive greenhouse grown tomatoes from Spain or Morocco, where the growing season is much longer.
Another seasonality factor that needs consideration is food storage. Often, fresh fruit and vegetables are refrigerated in order to increase the time they can be stored before being sold, and effectively increase the ‘season’ local produce can be sold for in a given country. The carbon cost of such storage is very difficult to quantify, as the conditions are so diverse, but depending on the time and method of storage, they can be significant.
In-depth Analysis
These issues highlight the inherent difficulty in collating such a broad data set in an applicable way. The diverse data sources, ‘holes’ in the data and countless assumptions that must be made to overcome these challenges mean the conclusions that can be drawn are of limited value. Saunders et al.’s in-depth investigation into the “Energy/Emissions Performance of New Zealand’s Agriculture Industry,” is a clear demonstration of the myriad factors that must be taken into account to be able to make a fair judgement on the carbon emissions of the products we purchase. Their 120 page report investigates the impact of just four products, produced in only two different countries. However, it takes into account the emissions associated with machinery, farm buildings, fodder, animal bedding, fertilizer components, etc. in addition to accurate transport and seasonality data. The found very interesting results, for milk, sheep-meat and apples, it was more carbon efficient to buy New Zealand produced products in the UK, “even including the transport cost.” Onions can be produced in the UK in a more energy efficient way, however the storage costs in the UK outweigh the shipping costs from New Zealand during months when onions are not in season in the UK.
Based on these findings, we felt that attempting to make product-specific recommendations for Swiss consumers would be of limited utility. There is such minimal information regarding the production, emissions and transport of specific foods that the conclusions that can be drawn are of a very global nature. Current ‘carbon foodprint’ calculators such as this one advertised in the UK use global average values. While they give a useful overview, they lack key details which would be useful to a consumer wanting to minimize their carbon output on a local scale. Compared to other countries, Switzerland has incredibly detailed data available regarding imports, exports and consumption, and yet it was still not feasible to draw clear product-specific conclusions from this data. The New Zealand study emphasizes the depth of information that must be sourced to be able to make clear recommendations on food choices based on your location and the current season.